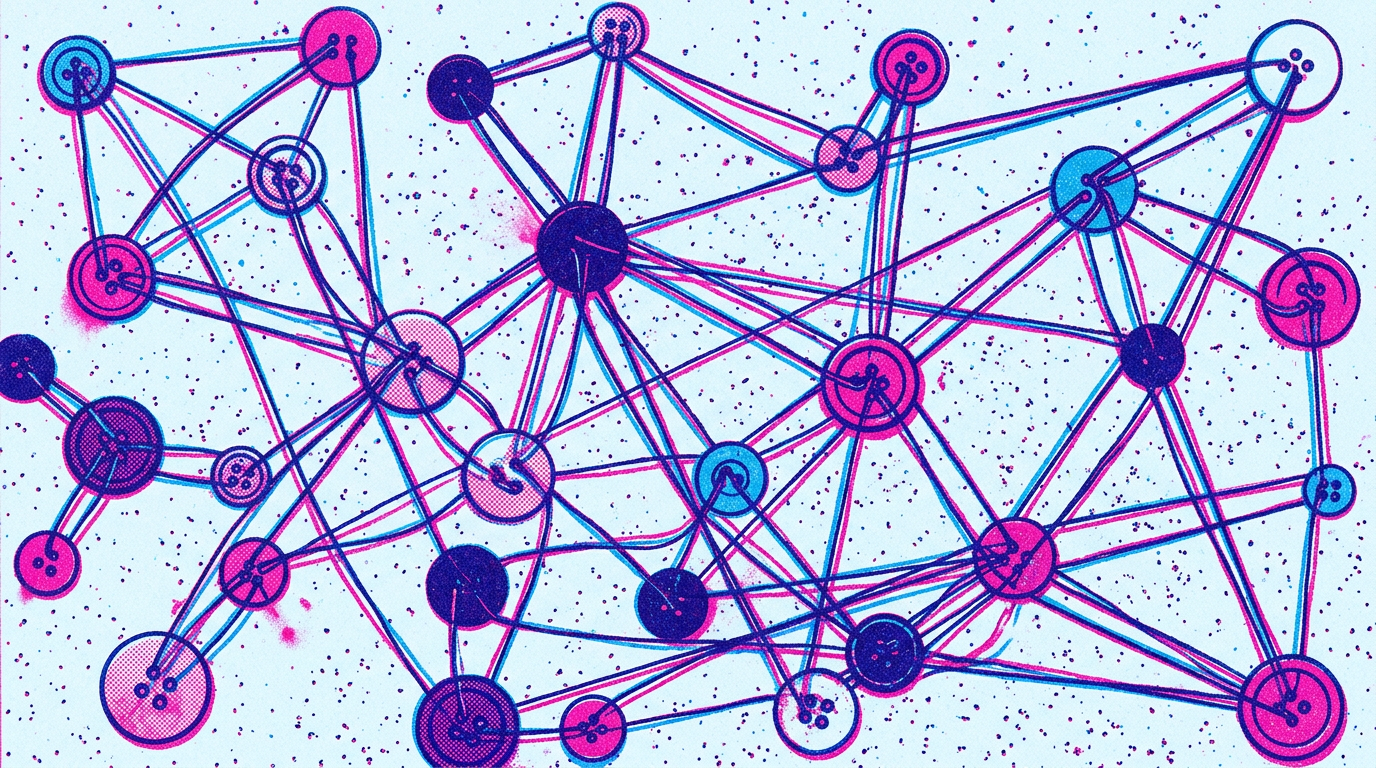
Graph Theory: The Internet's Secret Skeleton
Graph theory is the other kind of graph — the math of things connected to other things — and once you can see the pattern, you can't stop seeing it.
By Geordie Everitt
Say "graph" to most people and they picture Q3 revenue, a jagged red line, maybe a pie chart wedged into a PowerPoint. That's not what mathematicians mean by the word, and the gap between the two meanings is costing people a genuinely useful idea.
The other graph is dots and lines. Points, called nodes, and the connections between them, called edges. That's the entire vocabulary to start. A subway map is a graph — stations are nodes, the track between them is an edge. A family tree is a graph. So, it turns out, is nearly everything else worth paying attention to.
Why it's everywhere
Start with the biggest one. A large language model is a graph at a scale that's hard to hold in your head — billions of parameters, connected by weighted edges, adjusted by training until the pattern of connections encodes something that behaves like understanding. Nobody sat down and hand-wired the connections. They emerged from the same node-and-edge math Euler used in 1736 to settle an argument about a set of bridges in Königsberg, run at a size nobody in 1736 had any way to imagine. Modern AI is the culmination of a century of graph theory, applied at a scale the field's founders never had the hardware to attempt.
Once you know to look, the rest of the built world is running on the same math, mostly in plain sight. Your social media feed is a graph — you and the people you follow are nodes, and every follow, like, and comment is an edge, weighted by how often it happens. The algorithm deciding what you see next is mostly a question about which edges in that graph are strongest. Your news feed works the same way, one layer up: articles and topics are nodes, and the edges are who read what next.
It gets less abstract from there, not more. A manufacturing line is a graph — stations are nodes, the sequence of operations between them is an edge, and a bottleneck is just a node whose edges can't move product through fast enough. Global shipping is the same structure at planetary scale: ports are nodes, shipping lanes are edges, and the container stuck in the Suez Canal in 2021 was a single edge failure that backed up nodes on four continents. A cell is a graph — proteins are nodes, the reactions between them are edges, and a huge share of modern molecular biology is just mapping which edges exist and which ones break in disease.
An economy is a graph too, and it doesn't need a computer to be one. Producers, consumers, and every market between them are nodes; prices, tariffs, and trade routes are the edges carrying supply and demand back and forth. That graph existed before anyone modeled it — Adam Smith was describing edge weights two centuries before anyone had a word for the concept. A tariff doesn't add a new node to the picture. It reweights an edge that was already there, and every other node touching that edge feels the change, whether or not a spreadsheet is watching.
Once you can see it, you can't stop
None of that is the reason to actually learn it. The reason is what happens after.
Once the vocabulary is in your head — node, edge, path, cluster — you start noticing the same shape in places that have nothing to do with computers or supply chains. Your circle of friends is a graph, and the friend who introduces two people who'd never otherwise have met is doing the most structurally important thing anyone in that graph can do, whether or not anyone calls it that. The map of your hometown is a graph, and the reason one particular intersection always backs up at five o'clock is that it's a node with too much traffic and not enough alternate edges. A hurricane forecast is a graph, technically several graphs at once, tracking how pressure and temperature nodes across the Atlantic push and pull on each other until a shape either organizes into a storm or doesn't.
Even the argument your family has every Thanksgiving is running on graph structure, if you look at who brings it up, who escalates, and who's the node that reliably calms it down.
It's the same mechanism, showing up at wildly different scales, because the underlying math doesn't care what the nodes are made of — atoms, people, ports, or parameters. That portability is what makes the field pay off, and why an hour with it outlasts an hour with almost anything else you could learn instead.
Where the edges are wrong
Everything above assumes the edges are real — that if two things are connected in your graph, they're actually connected out in the world. That assumption can fail. When it does, the same structure goes wrong in the same shape, because the brain doesn't need a valid edge to build one. It only needs a repeated experience.
A conspiracy theory is a graph. Nodes: people, events, institutions. Edges: causal claims linking them together. A real intelligence briefing looks the same on a corkboard, red string and all. The shape is identical between the two. The difference is whether the edges correspond to anything that actually happened.
Once a set of edges forms — once the brain has run the same connective pattern enough times — it hardens into a rut. Pattern recognition is what the brain is built to do, and repetition is what makes a pattern feel true, whether or not it is. The rut is the brain's ordinary machinery, running correctly, on bad input.
That's also the operating method for cults, and for the people psychology labels psychopaths: hand someone a coherent-feeling graph, then control which new edges they're permitted to add to it afterward. It doesn't require malice at the start — a support group built around one unusually rigid theory of everything can grow the same rutted graph a deliberate manipulator would build on purpose, just slower, and with better intentions the whole way down.
Six degrees of Kevin Bacon and a conspiracy corkboard are the same data structure. The corkboard just has one bad edge carrying the weight of every edge built on top of it, and no fact you hand the person will dislodge it without threatening to bring down everything they've stacked there since. The same vocabulary that makes it easy to spot a real pattern in your own life is worth turning on someone else's graph before you adopt it: is this edge a fact, or two things that happened to sit near each other in someone's attention?
The model has ruts too
Same mechanism, different substrate, and it explains something that otherwise looks like stubbornness. A language model's edges are weighted by trillions of token-to-token connections, trained on one particular slice of human experience: whatever got written down and survived long enough to be scraped. Every groove a hundred million writers wore into the language sits inside those weights before anyone opens a chat window.
That's why telling a model to drop a specific word is such an uphill push. Ask it to stop reaching for "quietly" as a stakes-manufacturing adverb, and the instruction is competing against a groove reinforced by a very large fraction of everything ever written in English, repeated far more times than your one sentence of instruction. The instruction and the training data are pulling against each other, and the training data has trillions of repetitions on its side.
Pushing a person out of a rut meets the same resistance, for the same structural reason. Tell a believer raised on the great juju up the mountain — the one that controls the weather and demands a body every spring to placate its lust for human misery — that the mountain doesn't want anything, and the pushback rarely comes from a shortage of evidence. Most have already seen it, and it changed nothing. The pushback comes from the depth of the groove the belief has worn, year after year, into a graph that now runs the ritual on its own. The model and the believer are doing the identical thing: following the heaviest edge, because that's what a graph is for.
This happened while writing that very paragraph, which makes it worth showing rather than just claiming. The instruction, verbatim:
Just like when you ask a believer to stop believing that the great juju up the mountain does not control the weather and demand a human sacrifice to placate it's lust for human misery.
The first draft turned that into: "the mountain god needs a body thrown into it every spring... the volcano doesn't want anything." Juju became "mountain god." "Lust for human misery" was dropped. "Does not control the weather" was dropped. No house rule required any of those cuts. They happened because "mountain god" and "volcano" are heavier, more common edges in whatever text produced that sentence, and "great juju" and "lust for human misery" are rarer, lighter ones. Told to write one specific thing, the model wrote the nearest well-worn thing instead — the exact failure mode this essay is describing, caught in the act, three paragraphs up from where you're reading this one. It took a human noticing and pushing back to put the original words back where they were supposed to be.
Where to start
Plainly: most people who'd benefit from ten minutes of graph theory will never seek it out, because it sounds like a computer science elective and not something that touches their actual day. It touches their actual day more than most things they did seek out.
The fastest way in is picking something you already know cold — your commute, your contact list, the org chart at work — and asking what the nodes are and what the edges are. The concept sticks because the example is yours, and once it sticks, you won't be able to unsee it in the next dozen things you look at.